Architecture Overview
In this use case, Oracle GoldenGate StatsD metrics are collected from an on-premises environment and forwarded to OCI Monitoring where they are consumed by observability and management tools to provide monitoring, alerting and visualization.
For more information about Oracle GoldenGate StatsD feature, refer to the Oracle GoldenGate StatsD documentation:
https://docs.oracle.com/en/database/goldengate/core/26/coredoc/monitor-enable-statsd.html
In a replication environment where both on-premises Oracle GoldenGate and OCI GoldenGate deployments are used within the same project, this architecture provides a unified monitoring environment for both platforms. This enables observability and management tools to monitor, analyze, and manage replication operations from a single pane of glass.
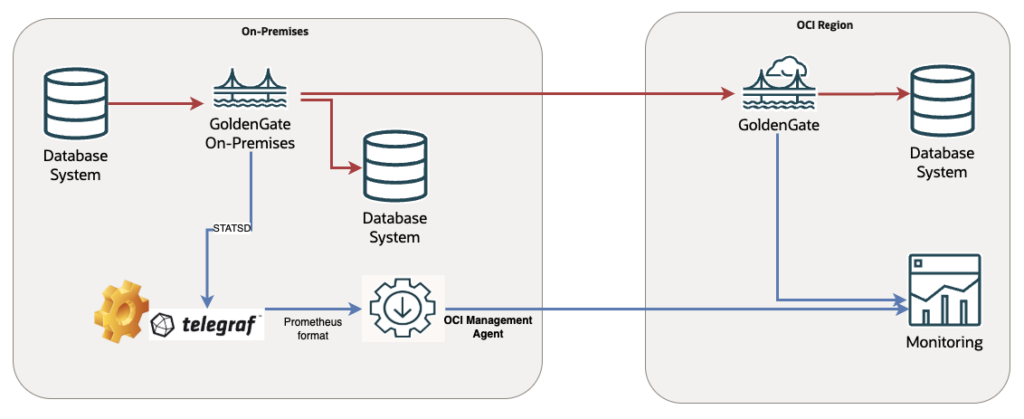
At the time of writing, there is no direct integration between Oracle GoldenGate StatsD metrics and OCI Monitoring through Oracle Observability & Management (O&M) tools. While OCI Monitoring supports custom metric ingestion, our objective is to minimize custom development and leverage existing products and services wherever possible. The proposed architecture uses the open-source Telegraf agent to collect Oracle GoldenGate StatsD metrics and expose them in Prometheus format. These metrics can then be captured and forwarded by the OCI Management Agent to OCI Monitoring. This approach enables Oracle GoldenGate metrics to be integrated into OCI Observability & Management with minimal custom implementation, while taking advantage of supported, industry-standard monitoring components.
Hands-On Lab: Sending On-Premises GoldenGate StatsD Metrics to OCI Monitoring
In this lab, the Telegraf agent is installed on the server with IP address 192.168.1.138. Replace this IP address with the hostname or IP address of the server where Telegraf is configured to listen for StatsD metrics.
Telegraf Agent Configuration
As the first step, install the Telegraf agent.
https://docs.influxdata.com/telegraf/v1/install
The Telegraf Prometheus output plugin should be configured to expose the collected Oracle GoldenGate StatsD metrics through a Prometheus-compatible endpoint for the OCI Management Agent.
https://docs.influxdata.com/telegraf/v1/output-plugins/prometheus_client
Telegraf can also collect additional system-level metrics, such as operating system statistics. If both Oracle GoldenGate StatsD metrics and host-level operating system metrics are required, it is recommended to deploy the Telegraf agent on the same server where Oracle GoldenGate is running.
Following example shows the Telegraf input and output configuration used for this setup. In this configuration, Telegraf listens for incoming StatsD metrics on UDP port 8125. Oracle GoldenGate should be configured to send its StatsD metrics to this host and port. The collected StatsD metrics are then exposed through the Telegraf Prometheus client output plugin on port 9273 under the /metrics endpoint. This Prometheus-compatible endpoint can be used by the OCI Management Agent.
[[inputs.statsd]]
protocol = "udp"
max_tcp_connections = 250
tcp_keep_alive = false
service_address = ":8125"
delete_gauges = true
delete_counters = true
delete_sets = true
delete_timings = true
percentiles = [50.0, 90.0, 99.0, 99.9, 99.95, 100.0]
metric_separator = "_"
datadog_extensions = false
datadog_distributions = false
datadog_keep_container_tag = false
allowed_pending_messages = 10000
percentile_limit = 1000
[[outputs.prometheus_client]]
listen = ":9273"
metric_version = 2
path = "/metrics"GoldenGate StatsD configuration
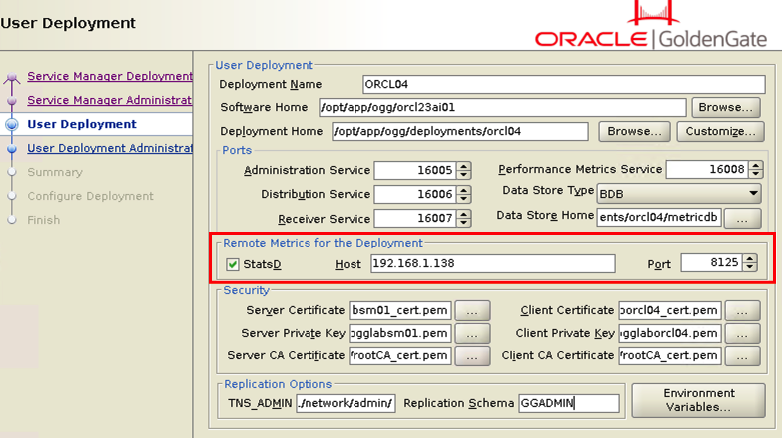
Oracle GoldenGate StatsD configuration can be performed either by configuration assistant during deployment creation or by REST API for existing deployments.
Deployment Creation
You can configure StatsD during the Oracle GoldenGate deployment creation.
REST API
You can configure StatsD for existing deployments by using the REST API.
Stop the deployment before updating the StatsD configuration.
Enable StatsD:
curl -k -svu user:password -H "Content-Type: application/json" -X PATCH https://192.168.1.138:16000/services/v2/deployments/ORCL04 --data '{
  "metrics": {
    "enabled": true,
    "servers": [
      {
        "protocol": "uds",
        "socket": "PMSERVER.s",
        "type": "pmsrvr"
      },
      {
        "protocol": "udp",
        "port": 8125,
        "host": "192.168.1.138",
        "type": "statsd"
      }
    ]
  }
}'
Check the configuration:
curl -k -u user:password -s -H "Content-Type: application/json" -H "Accept: application/json" -X GET https://192.168.1.138:16000/services/v2/deployments/ORCL04 | jq .response.metrics
{
  "servers": [
    {
      "protocol": "uds",
      "socket": "PMSERVER.s",
      "type": "pmsrvr"
    },
    {
      "protocol": "udp",
      "port": 8125,
      "host": "192.168.1.138",
      "type": "statsd"
    }
  ],
  "enabled": true
}
Start the deployment.
After StatsD is configured, metrics should be captured and exposed by the Telegraf agent in Prometheus format. Before proceeding with the OCI Management Agent installation and OCI Monitoring configuration, it is recommended to validate that the Telegraf configuration is working as expected.
You can test the Prometheus endpoint by using any tool that supports reading Prometheus metrics. For example, you can install a Prometheus server and configure following job to ingest the metrics into the Prometheus database.
prometheus.yaml
- job_name: "telegraf"
  static_configs:
    - targets: ["192.168.1.138:9273"]
Install and Configure OCI Management Agent
Follow the official Oracle documentation to install the OCI Management Agent:
https://docs.oracle.com/en-us/iaas/management-agents/doc/install-management-agent-chapter.html
OCI Management Agent can be installed on any server that has network connectivity to the Telegraf Prometheus client endpoint. Server does not need to be the same host where Telegraf or Oracle GoldenGate is running, as long as it can access to the endpoint exposed by Telegraf.
The OCI Management Agent supports collecting metrics from Prometheus-compatible sources. For detailed configuration steps, refer to the official Oracle documentation:
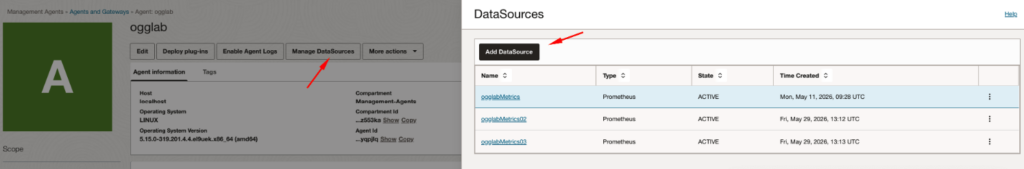
After the OCI Management Agent is installed and registered, the required data sources for Prometheus metric collection can be configured. In this example, not all exposed metrics are collected. Instead, a selected set of Oracle GoldenGate metrics is captured, based on the metrics we want to monitor in OCI Monitoring.
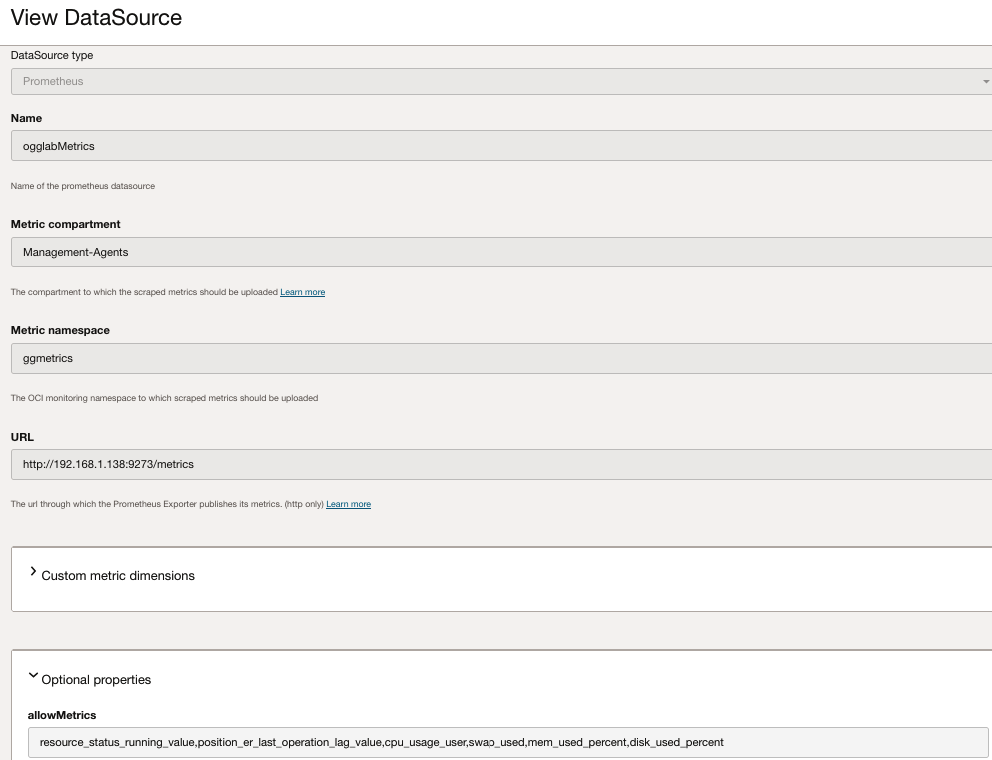
In the following example, the ogglabMetrics metric namespace is used to store the Oracle GoldenGate StatsD metrics in the Management-Agents compartment.
Ensure that the OCI Management Agents have the required permissions to publish custom metrics in this compartment.
A list of some available Oracle GoldenGate StatsD metrics is provided in the official Oracle GoldenGate documentation:
https://docs.oracle.com/en/database/goldengate/core/26/coredoc/monitor-enable-statsd.html
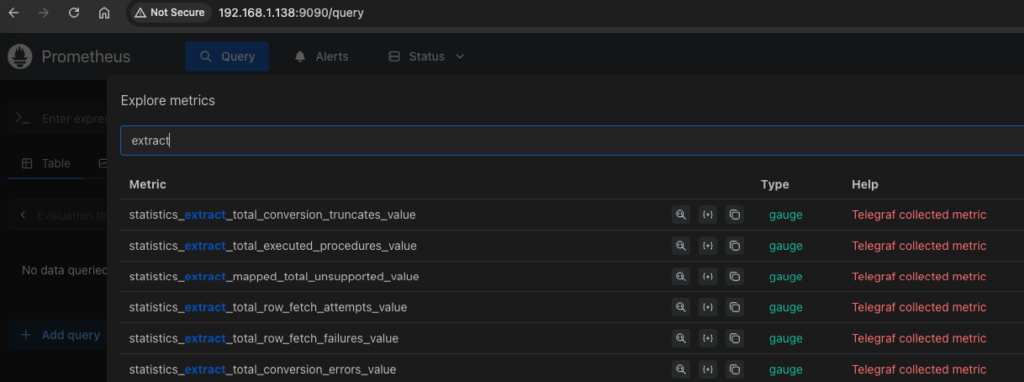
For investigation and testing, it is recommended to use a Prometheus database or any other Prometheus-compatible client tool to retrieve the list of available metrics directly from the Telegraf Prometheus endpoint. This allows you to verify which metrics are being exposed by Telegraf before configuring metric collection in OCI Monitoring.
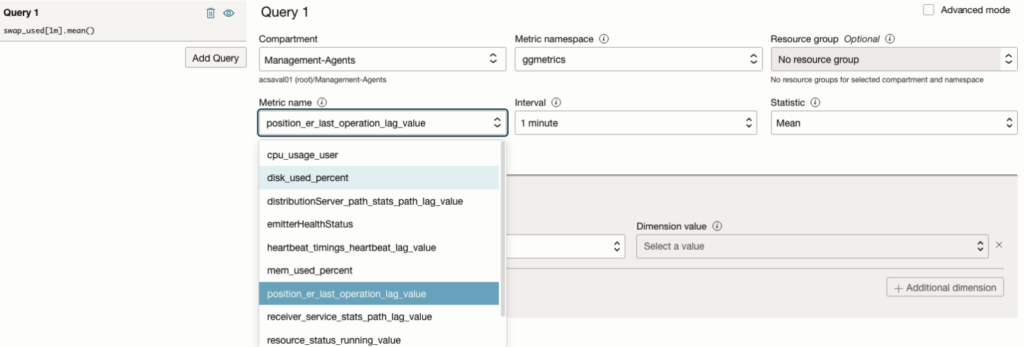
In this hands-on, following metrics are captured:
- resource_status_running_value
- position_er_last_operation_lag_value
- heartbeat_timings_heartbeat_lag_value
- distributionServer_path_stats_path_lag_value
- receiver_service_stats_path_lag_value
- cpu_usage_user
- swap_used
- mem_used_percent
- disk_used_percent
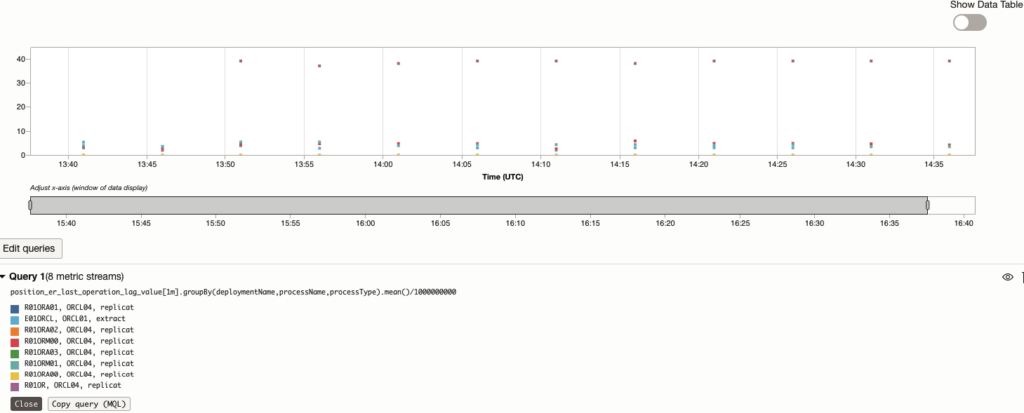
Configure OCI Monitoring with Oracle GoldenGate StatsD Metrics
Collected metrics can be queried from OCI Monitoring in the same way as any other metric available in OCI Monitoring. Once ingested, these metrics can be used by OCI Observability and Management services, including dashboards, alarms, metric queries, and visualization tools, enabling comprehensive monitoring and analysis of Oracle GoldenGate environments.